Pull up two different sources for Lanham, Maryland home prices this year and you will get two different stories. One shows prices climbing about 10 percent over the past year. The other, looking at the same town, shows prices falling by roughly 12 percent over the same window. Both numbers are current. Both are describing the same few square miles of Prince George's County.
That is not a typo or a bad data pull. It is a boundary problem, and once you understand it, it tells you something real about how to shop this market instead of just reading it.
Two Boundaries, One Name
The wider search area that most portals label "Lanham" pulls in a broad ZIP code footprint, including Glenn Dale, Seabrook, and the newer subdivisions strung along Greenbelt Road. Measured that way, the median sale price sat around $499,000 as of the most recent monthly reading in late 2025, up roughly 10 percent year over year, while the median price per square foot actually dropped about 7 percent over the same period.
Narrow the boundary to the core Lanham neighborhood itself, the older grid closer to Good Luck Road and the original commuter stock, and the picture flips. There, the median sale price recently ran closer to $468,000, down about 13 percent from a year earlier, while price per square foot jumped nearly 30 percent to around $280.
So the wide view says prices are up and space is getting cheaper per foot. The narrow view says prices are down and space is getting more expensive per foot. Neither is wrong. They are measuring different mixes of houses.
The Math Behind the Contradiction
When a market's median price falls while its price per square foot rises, the most common explanation is not that homes lost value. It is that smaller, pricier-per-foot homes made up more of that month's sales than they did a year earlier.
That is exactly what is happening inside core Lanham. Newer, compact, finish-heavy construction has been closing at a higher rate relative to the older, larger-lot homes that anchored the neighborhood for decades. Each individual home type may be holding or gaining value. The blended median just moves with whatever combination happened to sell that month.
This matters for a buyer because it means the single "Lanham price" you see on a search result is really an average of two very different products; it tells you almost nothing about what a specific type of home, in a specific pocket of the neighborhood, is actually worth right now.
A Neighborhood Built in Two Waves
Lanham's housing stock reads like two separate construction eras stitched together, because it is.
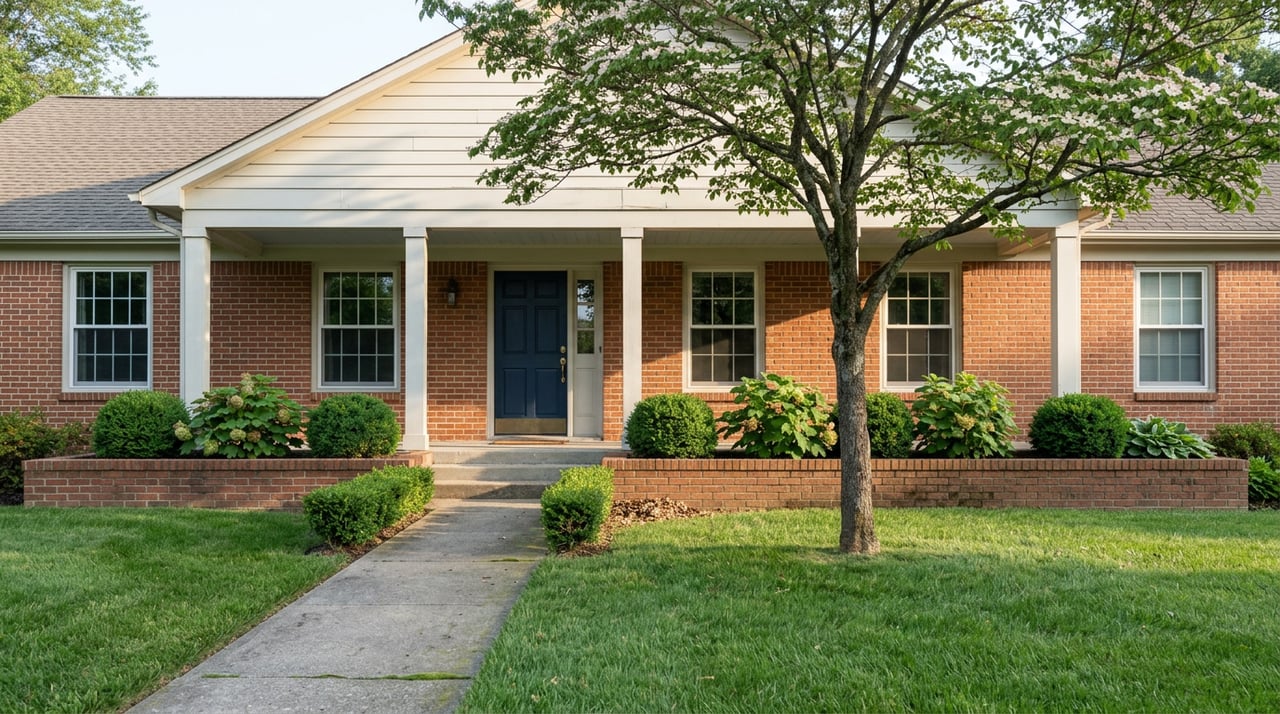
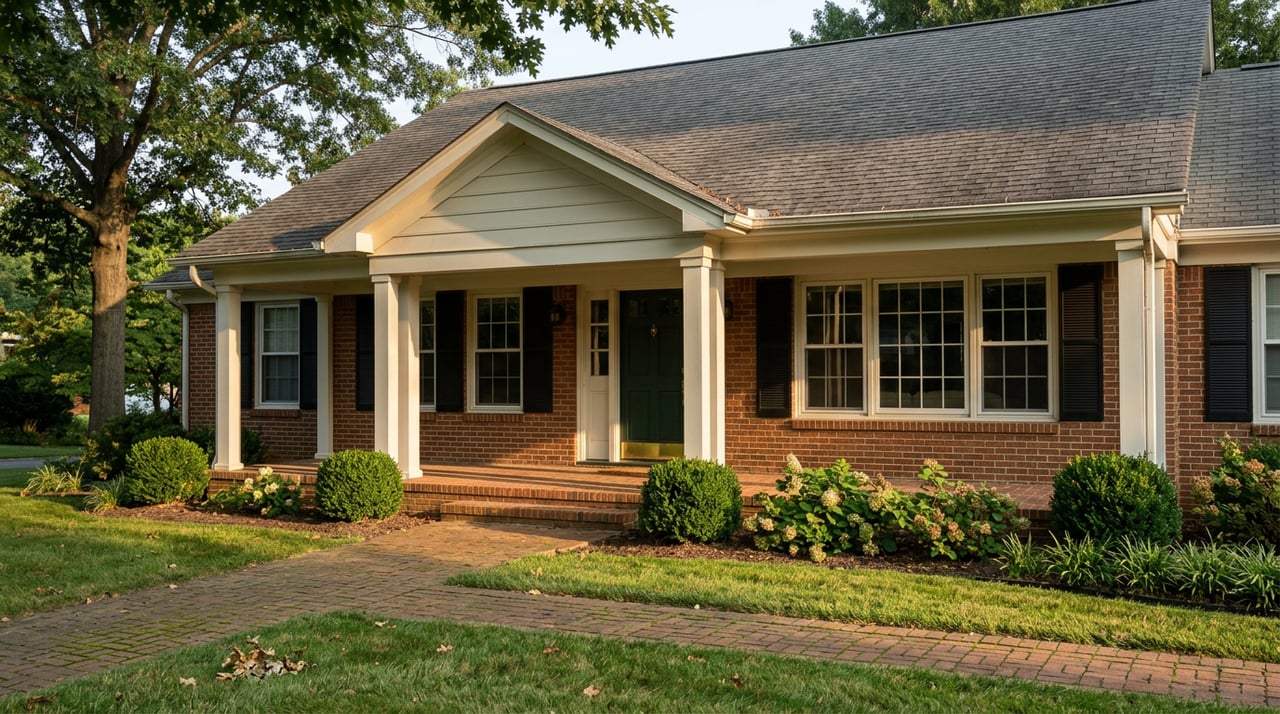
The first wave dates to the 1950s and 1960s, when the arrival of NASA's Goddard Space Flight Center in neighboring Greenbelt pulled scientists, engineers, and support staff into the area and builders answered with capes, ranches, and split-levels on generous lots. That stock still defines much of the neighborhood's character today, and it shows up in an unusual concentration of larger homes: Lanham has long carried a higher share of four- and five-bedroom houses than the vast majority of American communities, a legacy of building for growing mid-century families rather than starter households.
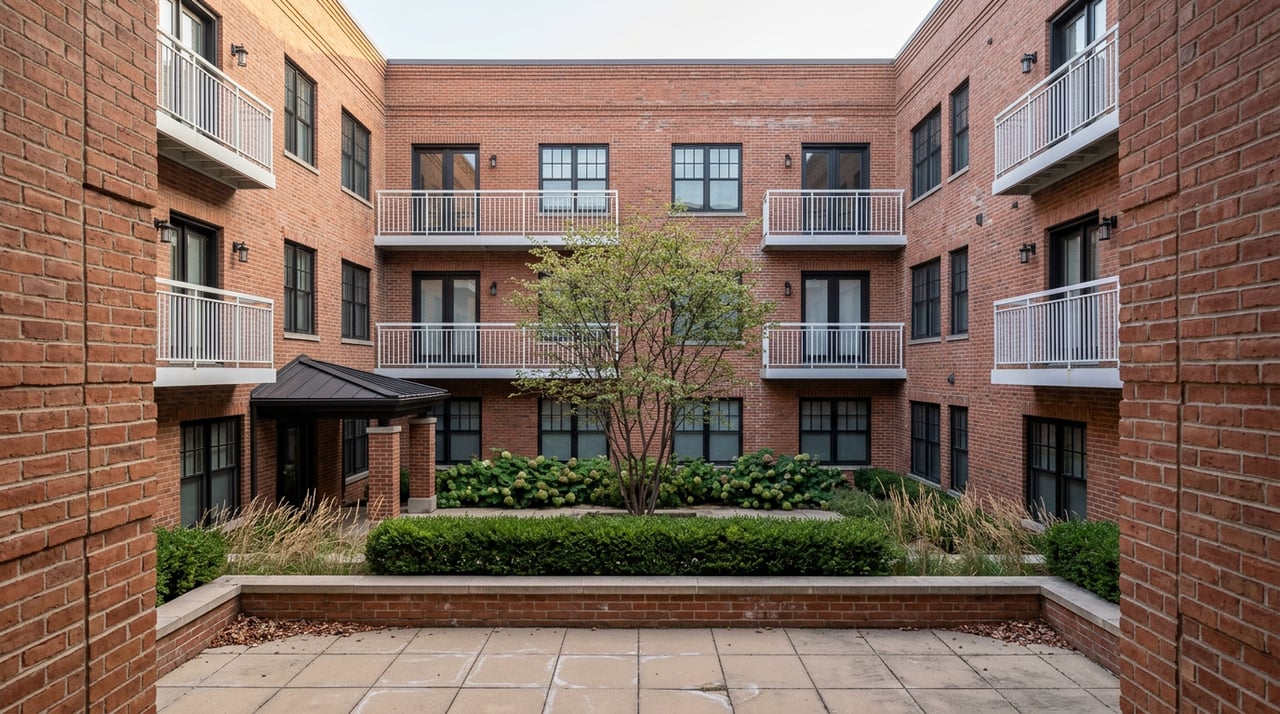
The second wave is happening now, and it is concentrated around the same employment corridor that built the first one. New townhouse and condo communities including Glenn Dale Crossing, built out by Ryan Homes and DRB Homes under the name The Towns at Glenn Dale Crossing, along with Glenn Dale Commons, Woodstream East, and Vista Gardens West, have gone up over the past five to eight years just off Greenbelt Road. Builder marketing for these communities leans directly on proximity to Lockheed Martin, the Social Security Administration, and NASA Goddard, the same employment anchors that shaped the neighborhood six decades ago.
The two waves are not competing for the same buyer. A young dual-income household weighing a two-car-garage townhome against a 25-minute commute is shopping a different product than a buyer looking for a fifth bedroom and a half-acre yard in an established block. But because both waves are geographically layered into the same reported "Lanham," their prices get folded into one number that satisfies neither buyer's actual question.
What Each Wave Actually Costs
| Housing type | Typical era | Typical footprint | Recent price range |
|---|---|---|---|
| Rancher, cape, or split-level | 1950s to 1960s | 1,200 to 2,000+ sq ft on larger lots | Blended neighborhood median near $475,000 as of early-to-mid 2026 |
| New-construction townhome (Glenn Dale Crossing, Woodstream East) | Built within the last 5 to 8 years | 1,600 to 2,900 sq ft across 2 to 4 finished levels | Roughly $385,000 to $549,000 as of January 2026 |
| Single-family in the broader Glenn Dale core | Mixed vintage, including recent new construction | Larger lots, some acreage | Median near $735,000 as of January 2026, with new-construction listings around $620,000 |
Read this table as three different conversations, not one price ladder. A buyer comparing the $475,000 blended figure against a $735,000 Glenn Dale median is not comparing apples to apples. They are comparing a compact new townhome market to a larger-lot, more established single-family market that happens to sit a few streets over.
The Slower Clock Underneath Both Numbers
Whichever boundary you use, one signal shows up consistently: homes are taking longer to sell than they were a year ago. In June 2026, homes across the broader Lanham area sold after a median of 46 days on market, up from 28 days over the same month the prior year, even as the number of homes sold rose from 91 to 102.
Read those two facts side by side and a clearer picture emerges. This is not a shrinking market. More homes are changing hands than a year ago. But each one is taking longer to find its buyer, which usually means less bidding pressure and more room for negotiation, particularly on the older single-family stock that is now competing directly against fresh construction for the same commuter budget.
For a seller with a 1960s rancher, that slower clock is worth planning around before listing, not discovering after 40 days with no offer. For a buyer, it means the leverage to ask for closing help or a home inspection contingency has quietly improved compared to a year ago, even in a neighborhood where the headline median still shows growth.
Reading the Number Correctly
Before you compare Lanham to any other Prince George's County neighborhood, or compare two listings inside Lanham to each other, ask which Lanham the number is describing. Is it the wide ZIP-level search radius that folds in Glenn Dale's larger, pricier stock? Or is it the tighter neighborhood boundary where new-construction townhomes are pulling the price-per-square-foot number up while pulling the raw median down?
The Maryland Department of Housing and Community Development happens to be headquartered right in Lanham, a detail Governor Wes Moore highlighted during a May 2026 visit focused on the state's broader housing supply agenda. It is a fitting bit of geography. Few neighborhoods in the DC metro fringe illustrate as clearly why a single median price is such a blunt instrument for understanding what is actually for sale.
If you are comparing an older single-family home against a newer townhome inside the same zip code, the fair comparison is not the neighborhood median against the neighborhood median. It is that specific home's price per square foot against comparable recent sales of its own type, in its own pocket of the neighborhood. Anything less specific is comparing two different housing markets that happen to share a mailing address.
A Few Practical Questions
Does a falling median mean Lanham home values are actually dropping? Not necessarily. A falling median combined with a rising price per square foot is a classic sign that the mix of homes selling has shifted, not that individual homes are losing value. Each home type needs to be evaluated on its own comparable sales.
Why do Glenn Dale and Lanham show such different numbers? They are technically separate unincorporated places within the same district, and depending on which ZIP-level search boundary a site uses, Glenn Dale's larger and pricier single-family stock may or may not be folded into the number labeled "Lanham."
Does the longer time on market mean sellers have to cut their price? Not automatically, but it does mean pricing accuracy and presentation matter more than they did a year ago. A home that sits past 46 days without adjustment tends to lose negotiating position, while one priced correctly for its specific type and pocket of the neighborhood can still move quickly.
If you are trying to figure out what a specific Lanham home is actually worth, not what the neighborhood-wide average says it should be worth, that is the kind of comparison Kim Kash works through with buyers and sellers every week. Let's connect.